MyFamily Archive - History - 141
Y-DNA Testing in Genealogy
John Corn - Sep 2, 2008
This article is intended to provide a non-technical explanation (i.e. - in layman’s terms) of the use of Y-DNA testing in genealogical research. For a more detailed technical explanation, you can look on the Internet.
There are several large organizations available these days to perform DNA testing. The National Geographic Society, IBM and the Waitt Family Foundation have joined together in partnership and created The Genographic Project to attempt to plot typical migration routes of people over the expanse of time. There is one particular organization available via the Internet called FamilyTree DNA that provide that actual testing for the Genographic Project. This particular organization sponsors research by family surname groups. To encourage researchers to cooperate in these surname groups, FamilyTree DNA provides a discount on testing for anyone who is willing to allow their test results to be added to the surname group database. They do not publish any personal information about the people who were tested, only the test results are published.
Some "distant" cousins are publishing a book and they also used FamilyTree DNA for their testing. Specifically, they were looking for a scientific method of connecting/separating the various branches of our family tree when complete documentation of a branch might not be available. This was of particular interest to me since Bible records disproved the existing theory of my branch’s ancestral connection so my family line basically “fell off” the family tree.
To understand how Y-DNA testing is used, we must first understand what Y-DNA testing really is. So let’s start at the beginning.
Every cell in the human body contains genetic blueprints called chromosomes. There are two types of chromosomes referred to as X-chromosomes and Y-chromosomes. Women have two X-chromosomes. Men have one X-chromosome and one Y-chromosome. DNA is the abbreviation for deoxyribonucleic acid, the molecular substance that all chromosomes are made of. Genes are sections of the DNA strand that contain specific characteristics for each person; brown hair, blue eyes, etc. In between the genes, there are sections of the DNA strand that do not contain any specific genetic codes. These “junk” sections are called genetic markers and they are found at specific locations along the DNA strand. These specific locations are called locus (plural - loci). Each of these loci are identified with a number or number-letter designation such as 393, 385B, 395S1a, etc. Very similar to a house number on the DNA “street.”
Note: Because these genetic markers exist in the “junk” DNA, they do not contain any personal information about the individual.

The picture on the right shows a visual representation of a small section of DNA. It looks much like someone took a ladder and twisted it. On each rung of the ladder, there are 2 balls (technically called nucleotides). Each ball is represented with one of 4 letters; A, C, G, or T. So, as an example, if you were to map the sequence at any given locus, it might look like the following:
ACCGTGGATACGTATGATGATGATGATGATGATGCGGATCC
Now look at the same sequence with a few spaces added for clarity.
ACCGTGGATACGT ATG ATG ATG ATG ATG ATG ATG ATG CGGATCC

With the spaces added, it is easy to see the repeating pattern. These are called short repeating tandems, or STR for short. The geneticist doing this test would count the STRs and the result would be written as 395 = 8 meaning there are 8 STRs found at the locus 395. We are not even interested in what the exact pattern is, only how many times it repeats. It should be noted that not all geneticists agree on the name, location or number of relevant markers although there is a growing effort to create a world standard. However, at this time, DNA comparisons between individuals are best performed using test results from the same testing facility.
Y-DNA test results can provide several answers for genealogists. First, these test results fit into different groupings called haplogroups which indicate the general geographic area where a family line came from. Haplogroups are represented by letter-number combinations such as A3b, R1b1a, etc. Each letter or number (reading left to right) indicates a sub-region within the next larger geographic region.
Second, comparing any two individuals’ test results can be used to determine the length of time (in generations) back to the Most Recent Common Ancestor or MRCA. In a perfect world, Y-DNA would be passed down from father to son with no changes ever. However, in reality, Y-DNA changes over time because of genetic mutation. This is the basis for genealogical genetics.
Scientists have determined that different genetic markers actually mutate at slightly different rates. That is, statistically, marker 1 might change once every 5 generations while marker 2 might change every 3 generations and marker 3 might only change every 10 generations. Keep in mind that we don’t care what the specific number values are for each marker, only whether they match or not. Scientists use the differences in marker values to determine the probabilities of an MRCA within a certain number of generations. The probabilities are then listed as a percentage rate within a number of generations such as 95% probability within the last 14 generations. Greater accuracy can be obtained by comparing a larger number of genetic markers.
To better understand this concept, let’s compare 2 fictional people; A & B.
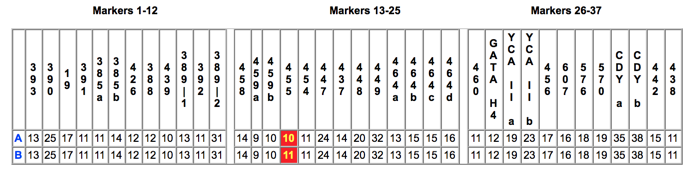
The first 12 marker values all match so these people definitely come from the same family line but we really cannot tell much more.
If we also compare markers 13-25, we have 1 mutation (Red highlight). We can look on a chart and determine that the probabilities of the MRCA are as follows:
50% probability MRCA within 17 generations (approx. 340 years)
90% probability MRCA within 40 generations (approx. 800 years)
95% probability MRCA within 48 generations (approx. 960 years)
Note that the length of time in years is still so long as to be practically useless. By expanding our comparison to 37 markers, we get the following:
50% probability MRCA within 12 generations (approx. 240 years)
90% probability MRCA within 27 generations (approx. 540 years)
95% probability MRCA within 33 generations (approx. 660 years)
In a best case scenario, if 100 markers all match exactly, there is still only a 50% probability of the MRCA having lived in the last 2 generations.
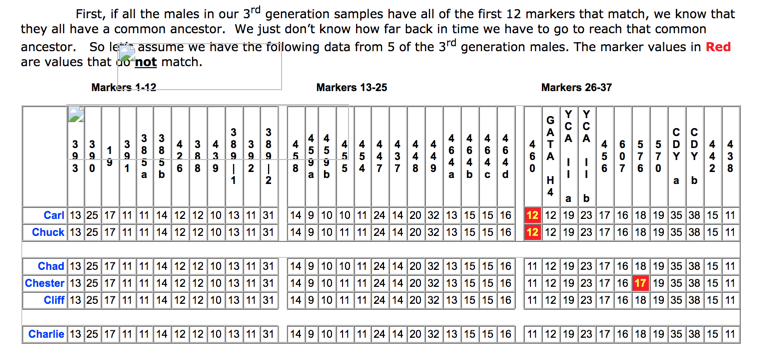
Third, these test results can be used to determine specific lineage within the family group. For discussion purposes, let’s begin with a fictitious family. We will focus on 3 generations and only on the males since we are discussing Y-DNA. The original male is called Adam. He has 3 sons that we will call Bill, Bob, and Brad. Bill has 2 sons Carl and Chuck. Bob has 3 sons; Chad, Chester and Cliff. Brad only has 1 son; Charles. This gives us the diagram below.

Some things to make note of - -
- Chad, Chester and Cliff are brothers but they have a different value for marker 32. This indicates that the mutation occurred in Chester since he is different.
- Carl and Chuck are also brothers. Their marker 26 is the same as each others but different from the rest of the samples. This means that the mutation probably occurred in Bill; their “most recent common ancestor” that differs from the rest. This is how you determine who came from which branch of the tree.
So, by knowing someone’s documented lineage and his marker values, we can build a picture of when mutations probably occurred and, therefore, how the genetic tree formed over time. So working backwards, we can create a list of marker values for older generations. This list will not be perfect, but it can be used to determine (within reasonable probabilities) which branch of a family’s lineage any one person probably came from.
The authors of the book asked a number of supposed relatives to participate in our family Y-DNA project. We all had documentation proving our heritage back 3 or 4 generations. We also knew that we were “supposed to be” descendants of JPC (1752-1843). Some participants had documentation proving which of JPC’s sons they descended from while others did not. We had two specific goals:
- To determine if, in fact, we are all related back through JPC.
- If related, how do each of us fit on our Family Tree
For the sake of privacy, I will refer to each of the people who took the test only by their initials.
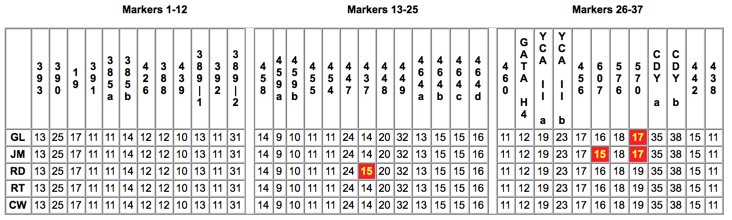
For our purposes, we will call JPC Generation 0; his sons will be Generation 1; his grandsons are Generation 2; etc. The table below shows our test results.
Conclusions:
- All 5 people are part of the haplogroup R1a meaning our distant ancestors (10,000+ years ago) came from the geographic region of Eastern Europe (what is now Poland, Ukraine, and the Czech Republic)
- GL and JM have the same mutation of allele 570. We have documented lineage showing that GL and JM do not share a common ancestor from Generation 2 on. The probabilities are extremely high that the common ancestor that GL and JM share was in Generation 1; a son of JPC. We also have documentation that GL descends from JPC through his son Peter (1792-1869). Therefore, by process of eliminating the impossible, JM must also descend from JPC through his son Peter. For further validation, we checked the census records for Peter and found that JM’s Generation 2 ancestor fit with the census numbers for male children of the appropriate age group. We also verified that the date of birth of JM’s Generation 2 ancestor did not conflict with the known dates of birth of any other children of Peter.
- CW and RT are a perfect match in all 37 markers. . RD is only off by 1 marker. We have documentation showing RD descends from JPC through his son Jesse (1796-1875). We also have documentation verifying that RT descends from JPC through his son Noah (1802-1874). CW has only been able to trace his lineage back to his Generation 2 relative HPC (1812-1900). These results show that CW is probably a descendant of JPC, therefore, HPC would also be a probable descendant of JPC. To take this conclusion any further, we would need test results from other descendants that descend from any of JPC’s brothers; George, Jesse and Samuel.
Since I am the JM referred to above, I am happy to say that my “fallen” branch has been successfully relocated on the Family Tree. If you are facing a similar problem, I urge you to join us in getting tested. As more people get involved, we will all know more about our roots.